


Monitoring your IT systems – all of them – is an increasingly important business function.
But while most organisations have multiple disparate systems with individual monitoring and logging systems, few have an integrated central view. This means that keeping an eye on your entire IT environment is overlaid with complexity and effort, which pretty much goes against the grain of modern technology.
So, how can you build a complete monitoring system? One with a centralised metrics repository and a powerful dashboard portal? Where you have a 360-degree view of all your systems?
Monitoring made easy
When it comes to enterprise monitoring, there are many different options available, but admittedly, it can sometimes be quite tricky to deliver a complete monitoring solution.
So, here’s a fast and easy solution we recommend, using Grafana, Influxdata and Telegraf.
They’re all open-source offerings that provide a centralised metrics repository with a powerful dashboard portal. And with this technology stack, monitoring your applications couldn’t be any easier.
Check out the diagram below for an example of what monitoring can look like for an enterprise using Docker-based applications.
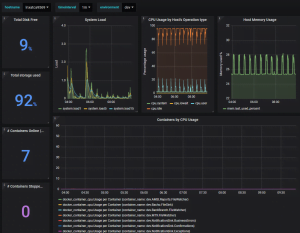
As you can see, all critical system metrics can be tracked and monitored, in the one place.
Stepping up to enterprise monitoring
Setting up a complete IT monitoring system can be done relatively quickly with our three open-source offerings. They each play a distinct role in the overall solution:
Telegraf is a metric collection and aggregation agent. It sits on target machine (where your applications lives) and continuously send critical metrics data to a datastore. In our example, we are using InfluxDB.
InfluxDB is a time-series database that Telegraf writes metrics to. It stores all your data, and like any other database, you can use a client (Influxb) to connect to it, and start writing queries and pull out relevant information.
And finally, Grafana. This is the dashboard which shows the current state of your system through querying and aggregating the collected metrics. It has some fancy widgets, and on top of that, it allows notifications to be sent out when a component goes down.
Summary
While you can struggle on trying to find a complete monitoring solution, you’ll find that using this technology super-stack will not only solve the problem quickly, but give you real bang for your buck.